Automated Troubleshooting of Kubernetes (K8s) Pods Issues
Automatically Collect K8s Pod Restart Reasons, Logs, and Events
This blog summarises an approach to increase the observability of Pod restart events and automate away the manual burden of investigating & troubleshooting. We have open-sourced our automation tool k8s-pod-restart-info-collector — a simple K8s customer controller that monitors Pods changes and sends Pod restart reasons, logs, and events to a Slack channel.
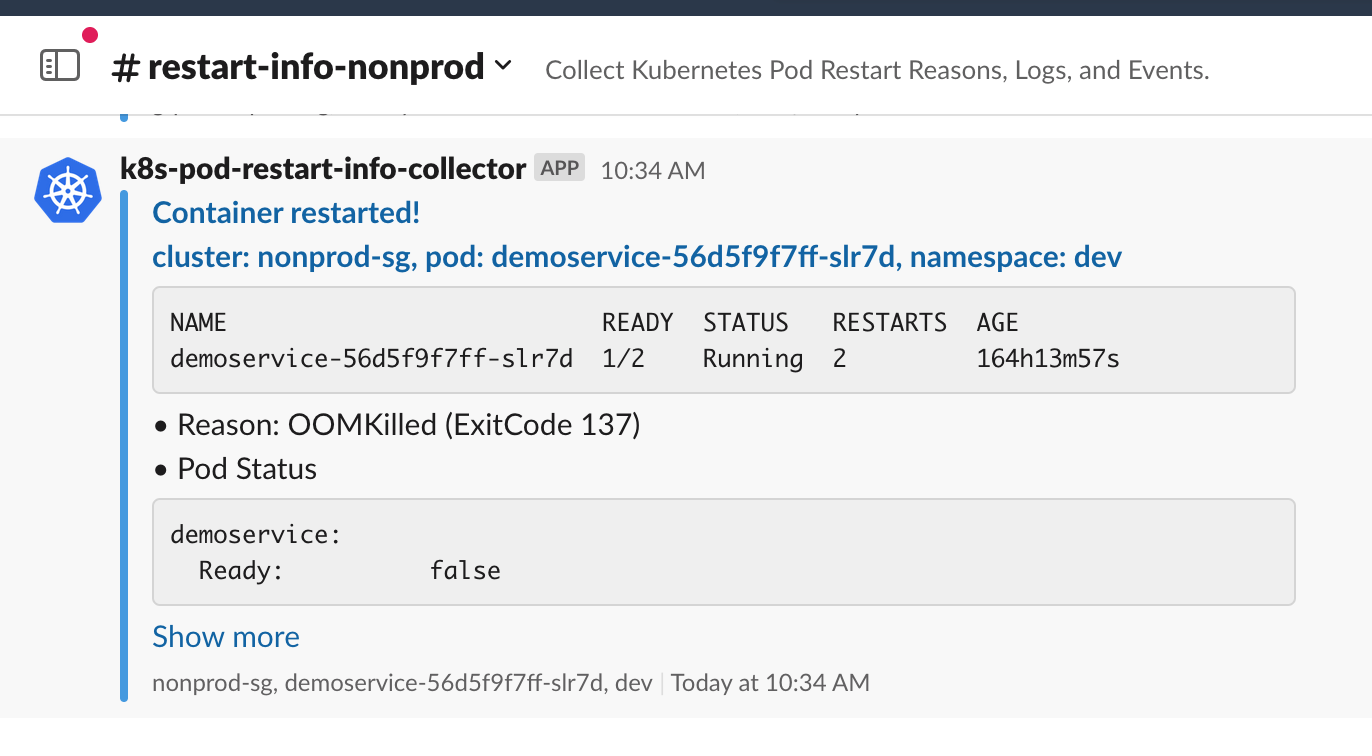
Here is an example of a brief alert message on Slack.
Background
At Airwallex, we have thousands of Pods running on more than a hundred K8s clusters. In K8s, Pods are considered to be relatively ephemeral (rather than durable) resources. Pod restart events occur pretty often; due to problems with memory (OOMKilled), CPU usage, or just applications exiting prematurely.
Manually troubleshooting K8s Pod issues is time-consuming and inefficient. This is because our engineers must repeat the same set of diagnostic commands on each Pod restart event as shown below.
The process of troubleshooting K8s Pod restarts is ripe for automation. This article outlines an approach to automatically trigger the publication of relevant context to Slack on each Pod restart event. As well as reducing manual burden, this approach also increases our observability coverage.
Troubleshoot Pod Issues
In the past, when a Pod restarted, we had to run the following commands to analyze the contexts manually:
1. Check Pod RESTARTS, READY and STATUS
$ kubectl get pod demoservice-56d5f9f7ff-slr7d
NAME                          READY  STATUS   RESTARTS  AGE
demoservice-56d5f9f7ff-slr7d  1/2    Running  2         164h13m57s
2. Check Pod Restart Reason, Last State, and resource settings. Special attention should be paid to resource Limits and Requests when troubleshooting OOMKilled issues.
$ kubectl describe pod demoservice-56d5f9f7ff-slr7d
...
  Ready:          false
  Restart Count:  2
  State:          Running
    Started:      Wed, 10 Aug 2022 02:34:48 +0000
  Last State:     Terminated
    Reason:       OOMKilled
    Exit Code:    137
    Started:      Mon, 08 Aug 2022 07:28:33 +0000
    Finished:     Wed, 10 Aug 2022 02:34:46 +0000
  Limits:
    cpu:     1
    memory:  1Gi
  Requests:
    cpu:     20m
    memory:  500Mi
...
3. Check Pod Events via kubectl get events | grep <podName>
4. Check Pod logs before restart via kubectl logs --previous <podName>
5. Check Node status via kubectl get node <nodeName>
6. Check Node Events via kubectl get events | grep <nodeName>
Automation to the rescue
Thankfully, we can automate the troubleshooting steps described above. This article outlines two methods to harvest Pod data and publish it to Slack. Moreover, we have open-sourced the code on GitHub, see https://github.com/airwallex/k8s-pod-restart-info-collector.
A detailed Slack alert message is shown below. We can see the Reason, Pod Status, Pod Events, Node Status and Events, and Pod Logs Before Restart.
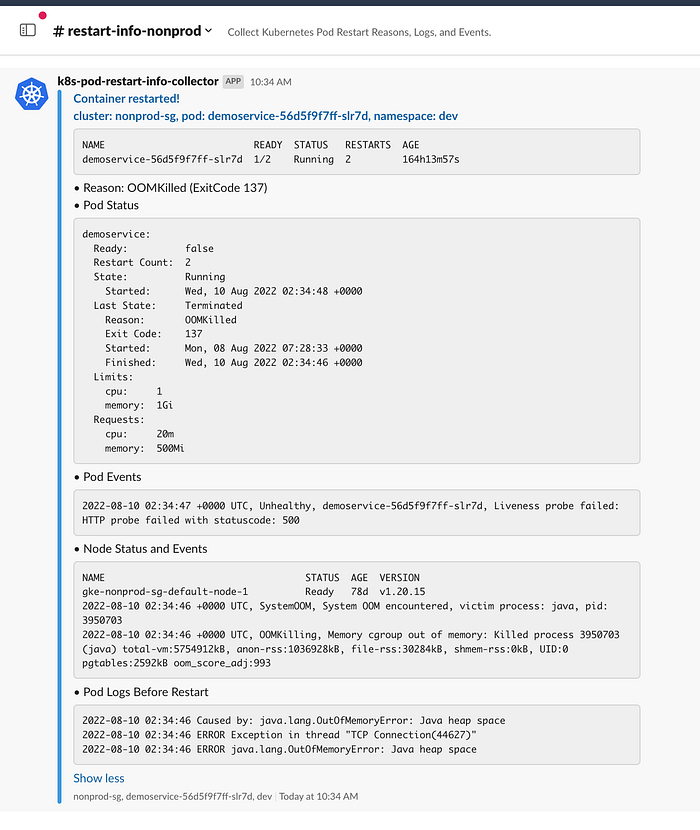
The Pod Status section displays the Restart Count, State, Last State, Reason, and container Limits and Requests settings.
According to the above message, the Pod restarted due to OOMKilled. Additionally, we can view the Pod logs before the restart and see that the Memory Limit is set to 1Gi.
Time-saving observability at our fingertips!
Method #1: Writing a Collector with Bash Script and Kubectl
This is a very simple method. We can make the kubectl get pod -Acommand run periodically, and compare the RESTARTS count. If the RESTARTS value rises, it indicates that the Pod restarted. The above kubectl commands are then run in sequence to collect the related information.
Finally, the collected information will be posted to a Slack channel using Slack Incoming Webhooks.
Method #2: Writing a K8s Custom Controller Using client-go Library
The first method is straightforward but inefficient because listing all Pods periodically can degrade the performance of the API server. To stay informed about when these events get triggered client-go provides Informers which solve this problem. We can write a Kubernetes custom controller using the client-go library to watch Pod changes and collect Pod Restart Reasons, Logs, and Events when a Pod restarts.
A K8s controller is a control loop that watches the state of the cluster through the API server. To build a K8s custom controller, please refer to Writing Controllers and client-go examples.
The project is open-sourced on GitHub, see https://github.com/airwallex/k8s-pod-restart-info-collector.
Summary
This article outlined two methods to harvest Pod data and publish it to Slack. As well as reducing manual burden this approach also increases observability coverage.
We have open-sourced our k8s-pod-restart-info-collector - a tool to automatically collect and send K8s Pod restart reasons, logs, and events to a Slack channel.
Now, troubleshooting Pod issues is very easy and has saved our engineers hundreds of hours.
Update: we have integrated this tool with our logging platform, metric platform and K8s management platform. It is very convenient for engineers to just click the links on the message to view it on the logging platform, metric platform and K8s managment platform.
References
Many thanks to Jetson Pan, Michael Liu, Alex Hilton, and Michelle Narayan for reviewing this blog.

