Check Kubernetes Resource Requests, Limits, and Utilization with Kube-capacity CLI
Kube-capacity is a simple and powerful CLI that provides an overview of the resource requests, limits, and utilization in a Kubernetes cluster. It combines the best parts of the output from kubectl top and kubectl describe into an easy to use CLI focused on cluster resources.

Installation
Go binaries are automatically built with each release by GoReleaser. These can be accessed on the GitHub releases page for this project.
Homebrew
This project can be installed with Homebrew:
brew tap robscott/tap
brew install robscott/tap/kube-capacity
Krew
This project can be installed with Krew:
kubectl krew install resource-capacityUsage
By default, kube-capacity will output a list of nodes with the total CPU and Memory resource requests and limits for all the pods running on them. For clusters with more than one node, the first line will also include cluster wide totals. That output will look something like this:

Including Pods
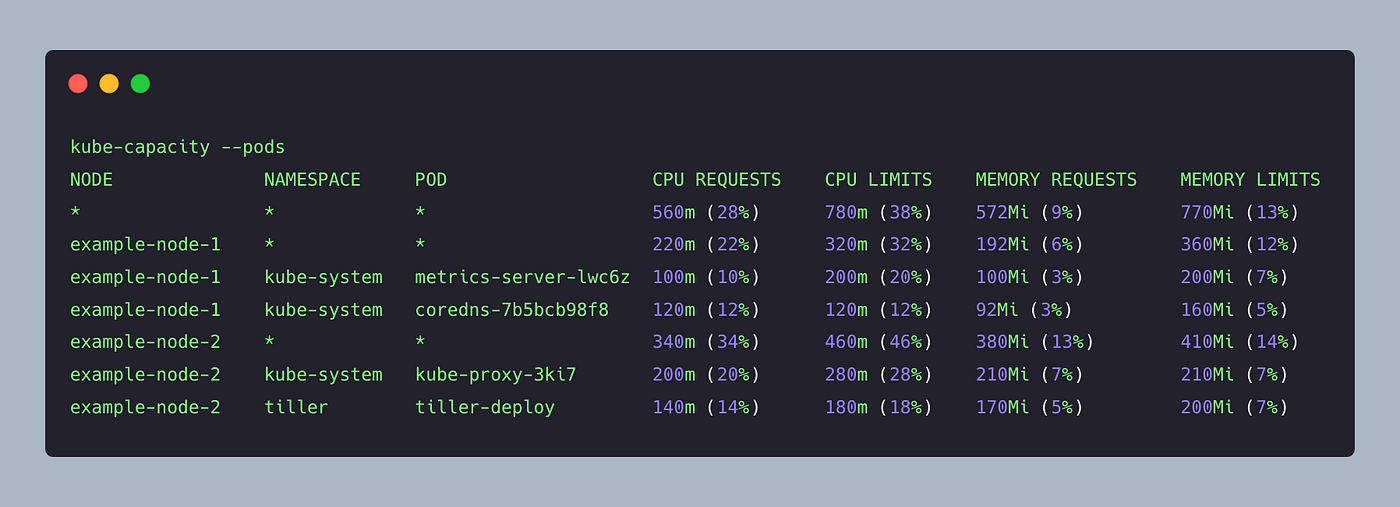
For more detailed output, kube-capacity can include pods in the output. When -p or --pods are passed to kube-capacity, it will include pod specific output that looks like this:
Including Utilization
To help understand how resource utilization compares to configured requests and limits, kube-capacity can include utilization metrics in the output. It’s important to note that this output relies on metrics-server functioning correctly in your cluster. When -u or --util are passed to kube-capacity, it will include resource utilization information that looks like this:
kube-capacity --utilIncluding Pods and Utilization
For more detailed output, kube-capacity can include both pods and resource utilization in the output. When --util and --pods are passed to kube-capacity, it will result in a wide output that looks like this:

kube-capacity --pods --utilIt’s worth noting that utilization numbers from pods will likely not add up to the total node utilization numbers. Unlike request and limit numbers where node and cluster level numbers represent a sum of pod values, node metrics come directly from metrics-server and will likely include other forms of resource utilization.
Sorting
To highlight the nodes, pods, and containers with the highest metrics, you can sort by a variety of columns:

kube-capacity --util --sort cpu.utilDisplaying Pod Count
To display the pod count of each node and the whole cluster, you can pass — pod-count argument:

Filtering By Labels
For more advanced usage, kube-capacity also supports filtering by pod, namespace, and/or node labels. The following examples show how to use these filters:
kube-capacity --pod-labels app=nginx
kube-capacity --namespace default
kube-capacity --namespace-labels team=api
kube-capacity --node-labels kubernetes.io/role=node
JSON and YAML Output
By default, kube-capacity will provide output in a table format. To view this data in JSON or YAML format, the output flag can be used. Here are some sample commands:
kube-capacity --pods --output json
kube-capacity --pods --containers --util --output yaml
Flags Supported

Prerequisites
Any commands requesting cluster utilization are dependent on metrics-server running on your cluster. If it’s not already installed, you can install it with the official helm chart.
GitHub Repo: https://github.com/robscott/kube-capacity